The Federal Reserve might be sounding the hawkish call, but a developing pattern in the bond market could cause it to pump the brakes, says one market watcher.
The yield curve, which tracks the difference between longer- and shorter-term bond yields, has begun to flatten. That situation is well-known as a portent of a potential economic recession, according to Paul Hickey.
The Bespoke Investment Group co-founder says that when short-term interest rates rise faster than long-term rates the yield curve inverts and raises big warnings on the economy.
"The Fed has really focused on the yield curve," Hickey told CNBC's "Trading Nation" on Wednesday. "By their own research, they say it's the single best predictor of an economic recession. While a flat yield by itself isn't bad, when it inverts and the yield curve for the 10-year yield starts to yield less than the three-month yield, that's when the red flags go up for a potential recession."
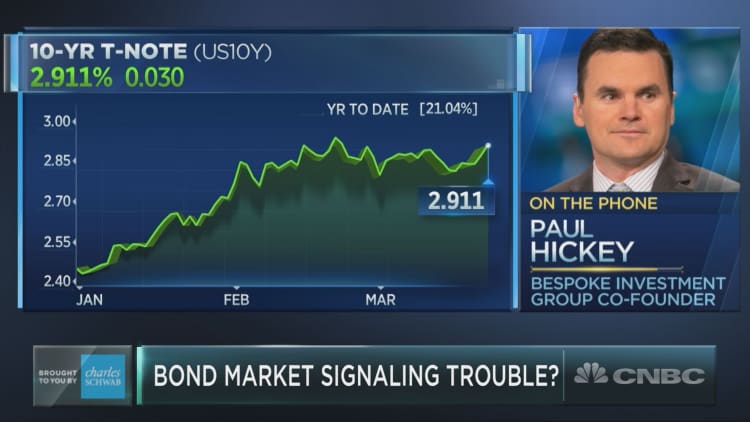
The yield on the 10-year Treasury bond declined to 2.82 percent on Thursday, its lowest level of the week, while the yield on the three-month bond dipped to 1.74 percent. Their difference sits at just more than 100 basis points.
"When you start getting to the mid-double digits and lower than that, I think the Fed is really going to face a decision," said Hickey. If they inverted the curve and "a recession followed they'd go down as intentionally causing a recession."
This is currently the longest time since the yield curve inverted, says Hickey. The bond market has not seen an inverted curve in 2,767 trading days, the longest streak in history. This stretch beat the last record of 2,265 trading days that ended in 1998.
As the relationship becomes more pronounced, Hickey predicts the Fed will grow more "hesitant to hike rates."
An inverted yield curve would be a first for the Fed during this tightening period. The yield curve has not inverted since 2007, right before the recession borne out of the financial crisis. Since then, the central bank has gone from dramatically cutting the fed funds rate to near-zero levels in late 2008 to inching it back up over the past two years to reflect normalized monetary policy.
The Fed first moved off of historically low rate levels in December 2015. Since then, the Federal Open Market Committee has hiked rates five more times, most recently at its meeting on Wednesday.
A flattening yield curve could portend pressure on the stock market, Hickey said. The key, he said, is how fast bond yields invert.
"A flat curve by itself doesn't spell trouble for the economy or the stock market but if you start to see it flatten rapidly and invert that's when you can really run into trouble for stocks."
The relationship between yield curve inversion and the stock market is mixed, according to Bespoke research. In the eight months before yield curves fell below 100 basis points to inversion in 2006, the climbed nearly 7 percent. The faster turn toward inversion over four months in 1973 saw the S&P 500 decline by 11.6 percent.