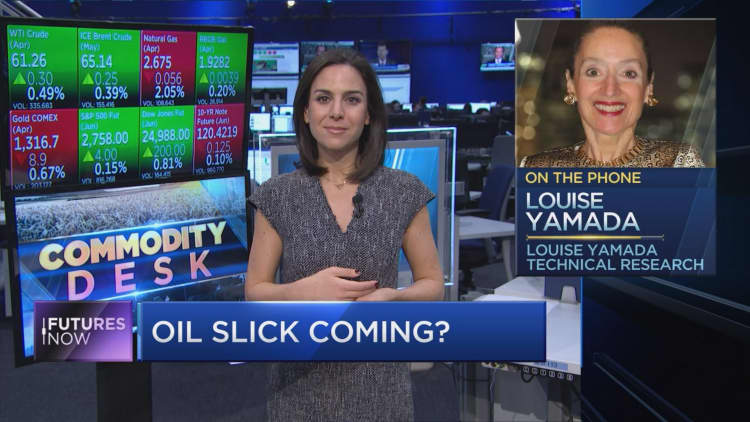
Wall Street technician Louise Yamada sees a pullback scenario unfolding for oil, which has rallied briskly this year.
She drew her conclusion based on a chart showing West Texas Intermediate (WTI) crude's trading patterns since September 2016.
"Over the past couple of months, you have what's created a descending triangle with lower highs on the rallies, and $58 [a barrel] comes in as a support level for this little triangle. So, on a short-term basis if $58 is broken on the downside, you could see the price slip," Yamada said Thursday on CNBC's "Futures Now."
In that situation, she sees levels that could fall to where the two moving averages are interacting on the chart — at $55 a barrel.
"If it were to go further, then the next support would be close to the uptrend, around the 2016 uptrend around $53," said Yamada, who runs Louise Yamada Technical Research Advisors.
Yamada points out the momentum indicators are negative, so odds are in the favor of a very short-term downturn before going back into rally mode. Since Feb.13 the commodity has been hugging the low $60s level.
It's not her first short-term bearish oil call on "Futures Now." Late last May, Yamada predicted a dip and it materialized. Three weeks later, WTI crude was down by about 15 percent before rallying again.
This time around, Yamada sees only one factor that could prevent an oil price drop to the $50s.
"If this doesn't break $58 and instead you see the price move up through $63.64, that would abort the trade." Yamada said.


